Have you ever wondered how a narrow stretch of water thousands of kilometers away can make your grocery bill and fuel costs skyrocket overnight? Welcome to FreeAstroScience.com, where we break down the science and geopolitics behind the headlines—so you can see how a single chokepoint can change your daily life. Today, we’re diving into the Strait of Hormuz crisis of 2026, a story that’s not just about oil tankers and warships, but about the price of tomatoes, the cost of your commute, and the future of food security for millions. Stick with us to the end, and you’ll understand not just what happened, but why it matters—and what we can do about it. You’re not alone in this. Let’s keep our minds active, because the sleep of reason breeds monsters.
Table of Contents
- How Can a 54-Kilometer Strait Shake the World’s Wallet?
- What Sparked the 2026 Strait of Hormuz Crisis?
- How Did Energy Prices Explode Overnight?
- How Did the Crisis Hit Italy’s Wallet? (ISTAT April 2026 Data)
- Why Are Food Prices Soaring? The Chain Reaction Explained
- What’s the Hidden Fertilizer Crisis No One’s Talking About?
- How Bad Is the Global Food Price Shock? (FAO & WFP Data)
- Who’s Paying the Highest Price? The Human Side of the Crisis
- Are Governments Doing Enough—or Just Playing Catch-Up?
- What Does This Crisis Really Tell Us About Our World?
When a Narrow Strait Changes What You Eat: The 2026 Hormuz Crisis and Its True Cost
How Can a 54-Kilometer Strait Shake the World’s Wallet?
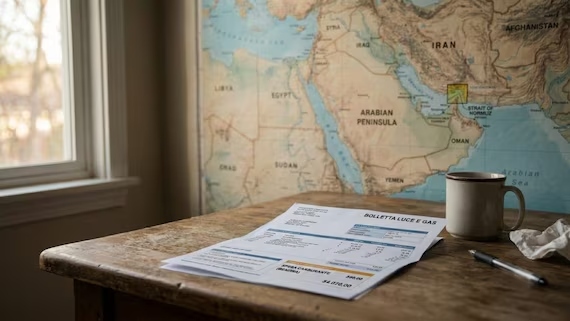
Let’s start with a map. The Strait of Hormuz is just 54 kilometers wide at its narrowest, squeezed between Iran and Oman. Yet, this tiny stretch of water is the main artery for the world’s energy. Every day, about 20 million barrels of oil—that’s roughly a fifth of all oil burned worldwide—pass through this bottleneck. Add to that 112 billion cubic meters of liquefied natural gas (LNG) each year, including almost all of Qatar’s exports. And don’t forget fertilizers: up to 30% of globally traded urea, ammonia, and phosphates—the stuff that keeps crops growing—sails through Hormuz. Most of these exports head to Asia. China alone takes nearly 38% of the flow. But when the strait closes, the shockwaves hit everyone. Oil, gas, and fertilizer prices spike worldwide. Suddenly, what happens in a narrow waterway far from Rome or Milan decides what you pay for tomatoes, bread, and bus tickets.
What Sparked the 2026 Strait of Hormuz Crisis?
The story didn’t start overnight. Here’s how the dominoes fell:
- Late 2025: Houthi attacks in the Red Sea make shipping risky. Insurance costs soar.
- February 28, 2026: Joint US-Israel airstrikes kill Iran’s Supreme Leader, Ali Khamenei, and top officials. Iran closes the Strait of Hormuz.
- March 1–5: Iran’s Revolutionary Guard issues threats, boards ships, and lays mines. All major shipping companies—Maersk, MSC, Hapag-Lloyd, CMA CGM, COSCO, Evergreen, PIL, HMM—halt Hormuz transits.
- March 4–8: At least 17 merchant ships are attacked or damaged. Two are abandoned.
- March 8: Brent crude oil rockets past $100 a barrel, peaking at $126—the sharpest monthly jump in decades.
- March–April: Over 150 ships anchor outside the strait. 20,000 mariners and 2,000 ships are stranded in the Persian Gulf.
- May 5: Iran sets up the Persian Gulf Strait Authority, charging up to $1 million per vessel. Only ships from China, Russia, India, Iraq, and Pakistan get limited passage.
- May: The UAE’s ADNOC says full oil flows through Hormuz won’t resume before 2027, even if the war ends.
And it’s not just Hormuz. The Red Sea’s Bab al-Mandeb chokepoint is also blocked. Nearly a quarter of the world’s energy and a huge chunk of Asia-to-Europe trade are stuck.
How Did Energy Prices Explode Overnight?
Oil and Gas: The Numbers That Hit Your Wallet
The numbers are jaw-dropping. Brent crude oil shot up from $72.48 a barrel on February 28 to a peak of $126 by March 8—a 55% surge in less than two weeks. The US benchmark, WTI, stayed above $100 for months. The EIA expects Brent to average $106 through early summer, then drop to $89 by year’s end—if things calm down.
Natural gas in Europe went wild. The Dutch TTF benchmark nearly doubled, from about €32/MWh to over €60/MWh by mid-March. Even after settling, it stayed 50% above pre-crisis levels. LNG futures in Europe hit $14.80/MMBtu, up 35%. In Asia, the Japan-Korea Marker soared 51% to $16.02/MMBtu. European gas storage was only 28% full—well below the five-year average—leaving the continent exposed.
The IEA now predicts a global oil supply deficit of 1.8 million barrels per day. OPEC warns markets may not recover until 2027. Inventories are falling by 8.5 million barrels per day. Some analysts say oil could hit $150–$200 a barrel if the crisis drags on.
At the Pump: What It Means for the Rest of the World
For ordinary people, the pain is real. In the US, gasoline jumped from $3.18 to $4.51 a gallon in a year—a 42% leap. Diesel soared 59%. In North America, gasoline prices rose 30% in March alone, with some regions seeing daily hikes of 5–10 cents per gallon.
In Italy, ISTAT reports gasoline at 1.943 €/liter by May 20, 2026 (up from 1.67 before the crisis). Diesel hit 1.977 €/liter (was 1.72). Heating oil is up 38.1% year-on-year; diesel for transport, 23%. In Thailand, diesel prices jumped 70%.
Shipping costs exploded. Insurance for a single VLCC voyage through Hormuz went from $125,000 to as much as $3 million. War risk premiums multiplied. Emergency container surcharges reached $4,000. Rerouting ships around Africa adds up to two weeks to delivery times. Bunker fuel in Singapore rose from $500 to $800 per metric ton. The daily cost of the Iran war for global shipping? About $400 million.
| Commodity | Pre-Crisis | Peak/Current | Change % |
|---|---|---|---|
| Brent crude oil | $72.48/bbl | $126/bbl | +55% |
| Dutch TTF gas | €32/MWh | €60/MWh | +87% |
| Italian gasoline | 1.67 €/L | 1.943 €/L | +16% |
| Italian diesel | 1.72 €/L | 1.977 €/L | +15% |
| US gasoline | $3.18/gal | $4.51/gal | +42% |
| US diesel | $3.55/gal | $5.65/gal | +59% |
| Thailand diesel | 29.94 THB/L | 50.54 THB/L | +70% |
| VLCC transit insurance | $125,000 | $2–3 million | +1,500%–2,300% |
How Did the Crisis Hit Italy’s Wallet? (ISTAT April 2026 Data)
Italy felt the shock fast and hard. The April 2026 ISTAT report shows NIC inflation at 2.7% year-on-year (up from 1.7% in March)—the highest since September 2023. The monthly jump was 1.1%, the biggest since October 2022. The harmonized index (HICP) showed a 2.8% annual rise.
Non-regulated energy prices swung from -2.0% to +9.6% year-on-year. Regulated energy went from -1.6% to +5.3%. Unprocessed food inflation accelerated from 4.7% to 5.9%. Core inflation (excluding energy and unprocessed food) actually fell to 1.6%. This isn’t a homegrown problem—it’s a shock from outside.
The “carrello della spesa” (shopping basket) rose 2.3% year-on-year. The most frequently bought products jumped 4.2%. ISTAT’s data is robust: 29 million price quotes each month, 80 municipalities, 84% of the population, and 20,700 petrol stations.
The numbers hit home. The Unione Nazionale Consumatori (UNC) estimates the average family will pay 731 euros more per year, with 198 euros just for groceries. Codacons puts the average at 893 euros, rising to 1,233 euros for larger families. Leggo reports up to 926 euros extra per family. The macroeconomic cost? 23 billion euros a year.
The Parliamentary Budget Office says GDP could shrink by 0.2–0.4 percentage points in 2026 and 2027, while inflation rises by 1.3 points in 2026 and 0.5 in 2027. Italian exports to the Middle East collapsed by 52.5% in March. The government has already spent over 1.3 billion euros on excise tax cuts.
Consumer advocates call this a “stangata”—a real blow. Gabriele Melluso, president of Assoutenti, urges the government to extend fuel tax cuts and crack down on speculation.
| Organization | Estimated Annual Extra Cost per Family | Notes |
|---|---|---|
| UNC (average family) | +731 € | +198 € for groceries |
| Codacons (average) | +893 € | Up to 1,233 € for large families |
| Leggo | +926 € | Estimate for 2026 |
Why Are Food Prices Soaring? The Chain Reaction Explained
How does a spike at the pump turn into a pricier tomato? Here’s the chain reaction:
- Oil prices jump. Running tractors, irrigating fields, processing food, and trucking it to stores all get more expensive.
- Fertilizer shipments stall. When fertilizer can’t get through Hormuz, prices soar. Farmers use less or switch crops. Yields drop at the next harvest. Food gets scarcer.
- Biofuel demand rises. High oil prices make it profitable to turn maize, sugar, and oilseeds into fuel instead of food.
- Shipping and insurance costs climb. Every imported food item costs more to land.
- Export restrictions spread. Governments try to protect their own markets, making global shortages worse.
In Italy, the April 2026 ISTAT data shows just how hard this hits:
| Product | Price Change (YoY %) | Category |
|---|---|---|
| Fresh tomatoes | +33.6% | Vegetable |
| Eggplants | +28.5% | Vegetable |
| Peas | +27.3% | Vegetable |
| Fennel | +23.5% | Vegetable |
| Strawberries | +17.4% | Fruit |
| Asparagus | +16.1% | Vegetable |
| Green beans | +14.1% | Vegetable |
| Cauliflower/Broccoli | +12.1%–13.4% | Vegetable |
| Melons | +10.6% | Fruit |
| Watermelons | +10.5% | Fruit |
| Peppers | +4.3%–8.9% | Vegetable |
| Oranges | +8.5% | Fruit |
| Beef and eggs | +8.3% | Animal product |
| Nuts | +4.4% | Fruit |
| Bananas | +3.6% | Fruit |
| Carrots/Turnips | +2.9% | Vegetable |
What’s the Hidden Fertilizer Crisis No One’s Talking About?
Here’s the hidden bomb: fertilizer. The Gulf region supplies 30–35% of global urea, 20–30% of ammonia, and 20% of phosphates. With Hormuz closed, 1.3 million tonnes per month of fertilizer shipments are stuck.
Prices have gone through the roof. Middle East granular urea jumped 19% in a week. Egyptian urea rose 28%. Urea futures hit $693/ton—up 49%. By April, urea was above $850/ton, up 80% since February. In Brazil, prices climbed 60%. In Somalia, urea soared 62.5% (from $40 to $65 per 50 kg sack).
Italy isn’t immune. Urea rose from 46 to 70 euros per quintal. Without enough fertilizer, wheat and corn yields could drop by half. The FAO warns: if Hormuz stays closed, a severe food price crisis could hit within 6–12 months. Unlike oil, there are no global fertilizer reserves. The pain builds slowly, but it’s coming.
How Bad Is the Global Food Price Shock? (FAO & WFP Data)
The FAO Food Price Index (FFPI) tells the story in numbers. In April 2026, the FFPI hit 130.7 points—up 1.6% from March and 2% year-on-year. That’s the third monthly rise in a row, and the highest since February 2023. It’s still below the 2022 Ukraine war peak, but the trend is up.
- Vegetable oils: 193.9 points (+5.9% in April), highest since July 2022. Palm oil rose for the fifth month straight.
- Meat: Record high, +1.2% from March, +6.4% year-on-year. Beef leads the way.
- Cereals: 111.3 points (+0.8% from March, +0.4% year-on-year). Wheat up 0.8%, maize up 0.7%, rice up 1.9%.
- Dairy: Down 1.1% in April.
- Sugar: Down 4.7% in April, -21.2% year-on-year.
The Kiel Institute says a full Hormuz closure could push wheat prices up 4.2% and fruit and vegetable prices up 5.2%.
Who’s Paying the Highest Price? The Human Side of the Crisis
The numbers are more than statistics—they’re lives. The World Food Programme warns that 45 million more people could face acute hunger by mid-2026 if the crisis drags on.
- West and Central Africa: 21% projected rise in food insecurity.
- East and Southern Africa: 17% increase.
- Asia: 24% more people at risk in 10 countries.
- Middle East and North Africa: 14% increase.
- Sudan: 80% of wheat is imported; 19 million already in famine.
- Somalia: Essential goods up 20%+, sugar +13.3%, rice +9.6%, flour +16%, cooking oil +21.4%, milk +42.8%.
- Most exposed: Zambia (+31%), Sri Lanka (+15%), Taiwan (+12%), Pakistan (+11%).
- Iran: Food inflation at 105% year-on-year.
- Bangladesh: Bottled water, cooking oil, eggs, and essentials up nearly 40%.
This crisis piles on top of climate shocks, debt, and shrinking aid budgets. The WFP says global food insecurity could soon match the worst days of the Ukraine war.
Are Governments Doing Enough—or Just Playing Catch-Up?
Governments are scrambling. Italy cut fuel excise taxes by 25 cents per liter (later adjusted), offered tax credits to transport and fishing companies, expanded the social card for low-income families, and beefed up price monitoring. Over 1.3 billion euros have been spent. Critics say these are temporary fixes—costly and not well-targeted.
The “razzo e piuma” (rocket and feather) effect is in full swing: prices shoot up fast, but fall slowly. Italian consumers get the worst of both.
Elsewhere:
- Germany: Temporary tax cuts on petrol and diesel.
- Slovenia: Fuel rationing—50 liters/day for private cars, 200 for businesses.
- India: Lowered excise duties, raised export duties.
- Philippines: Declared a national energy emergency.
- Spirit Airlines: Ceased operations due to fuel costs.
- Multiple countries: Eased sanctions on Russian oil; US extended a 30-day waiver for Russian oil at sea.
- European Commission: Urged early gas storage filling, coordinated alternative LNG sourcing.
- ECB: Delayed interest rate cuts, raised inflation forecasts, warned of stagflation.
- Pipeline capacity: Only 5–7 million barrels/day can bypass Hormuz—less than half the normal flow.
The World Bank projects a 24% jump in global energy prices for 2026, with fertilizer costs up 31%. Central banks are stuck: inflation is the priority, even if growth suffers.
What Does This Crisis Really Tell Us About Our World?
This isn’t just about oil, gas, or tomatoes. The Strait of Hormuz crisis is a living lesson in how tightly our world is wired together. A 54-kilometer-wide strait, thousands of kilometers from your home, can decide what you pay for dinner tonight.
We’ve seen this before. The 1970s oil crisis, the 2022 Ukraine war—same pattern: a supply shock, a price spiral, governments scrambling for answers. But today, the stakes are higher. Our world is more connected, more fragile, and more exposed.
At FreeAstroScience, we believe understanding these links isn’t optional. It’s survival. The sleep of reason breeds monsters. If we don’t ask questions, if we don’t see the connections, we’re at the mercy of every shock.
We need more than emergency band-aids. Renewable energy, strategic reserves, diversified supply chains—these aren’t luxuries. They’re the foundation of a world that can weather the next storm.
Conclusion
A narrow strait halfway across the globe has sent oil prices up 55%, pushed Italy’s inflation to 2.7%, and added up to €1,233 to the average family’s annual bill. Forty-five million people worldwide face hunger. Fertilizer shortages threaten next year’s harvests. Governments are doing what they can, but the root problem remains: our systems are too fragile, too interconnected, and too slow to adapt.
Let’s not wait for the next crisis to wake up. Keep your mind active. Ask questions. Demand better answers. And come back to FreeAstroScience.com—where we turn complexity into clarity, and where reason never sleeps.
References & Sources
- ISTAT Official Press Release: April 2026 Consumer Prices
- Geopop: Alessandra Lanza on ISTAT Hormuz Data
- FAO Food Price Index (April 2026)
- FAO Chief Economist: Hormuz Food Security Risks
- FAO: Fertilizer Scarcity Warning
- EIA Short-Term Energy Outlook (STEO)
- EIA: Strait of Hormuz Energy Flows
- IEA: Strait of Hormuz
- Reuters: No Full Hormuz Flows Until 2027 (ADNOC)
- Reuters: Euro Zone Growth Set to Slow (European Commission)
- Wikipedia: 2026 Strait of Hormuz Crisis
- Wikipedia: Economic Impact of the 2026 Iran War
- Wikipedia: 2026 Iran War Fuel Crisis
- WFP: Food Insecurity Projections
- Newsweek: Hormuz Crisis and US Fuel Prices
- Bloomberg: Iran War Hormuz Closure Oil Shock
- Euronews: European Food and Energy Exposure
- UNCTAD: Strait of Hormuz Trade Disruptions
- Carnegie Endowment: Iran Fertilizer and Food Security
- Kiel Institute: Food Price Analysis