
Mapping the Lives of Stars: What the Hertzsprung-Russell Diagram Really Tells Us
Introduction
What makes one star shine brighter than another? Why do some stars burn blue and hot, while others glow red and cool? If you’ve ever looked up at the night sky and wondered about the secret lives of stars, you’re not alone. We all share that sense of awe, staring into the cosmic ocean, searching for patterns and meaning.
Welcome to FreeAstroScience.com, where we believe science belongs to everyone. Here, we break down complex ideas—like the Hertzsprung-Russell diagram—into simple, clear language. Whether you’re a student, a science enthusiast, or just someone who loves to wonder, you’re in the right place. We’re a community that values curiosity, clarity, and the power of reason.
At FreeAstroScience, we urge you: never turn off your mind. Keep it active, keep it questioning. As Goya warned, the sleep of reason breeds monsters. So, let’s stay awake together.
Read on to the end, and you’ll see how a single chart can map the entire life story of a star—and maybe, just maybe, help you see the universe with new eyes.
Table of Contents
- 1. Who Drew the Map First? The History Behind the H-R Diagram
- 2. How Do You Read an H-R Diagram?
- 3. The Spectral Alphabet: How We Classify Stars
- 4. The Five Districts of the H-R Diagram
- 5. A Star’s Life Story, Written in One Chart
- 6. Star Clusters as H-R Diagram Laboratories
- 7. Measuring the Universe with the H-R Diagram: Spectroscopic Parallax
- 8. What the Gaia Mission Revealed About the H-R Diagram
- 9. Why Size and Temperature Both Matter: The Stefan-Boltzmann Law
Who Drew the Map First? The History Behind the H-R Diagram
Let’s travel back to the early 1900s. Two astronomers, working continents apart, were about to change how we see the stars forever.
Ejnar Hertzsprung, born in Denmark in 1873, was the first to notice something odd. In 1911, after years of work, he published diagrams showing that stars with the same color (or spectral type) could have wildly different luminosities. Some were giants, shining with thousands of times the Sun’s light. Others, dwarfs, were much dimmer. Hertzsprung’s insight cracked open the door to understanding stellar evolution .
Meanwhile, across the Atlantic, Henry Norris Russell at Princeton Observatory was plotting his own path. In 1913, Russell published a diagram that plotted stellar luminosity against spectral type, using data from the Henry Draper Catalogue. This catalogue, built by the tireless work of Edward Charles Pickering, Antonia Maury, and Annie Jump Cannon at Harvard, classified the spectra of tens of thousands of stars. Russell’s version spread quickly, and soon, the Hertzsprung-Russell diagram—or H-R diagram—became astronomy’s greatest map.
Two scientists, one idea: stars aren’t all the same. Their light tells a story, and the H-R diagram is the key.
How Do You Read an H-R Diagram?
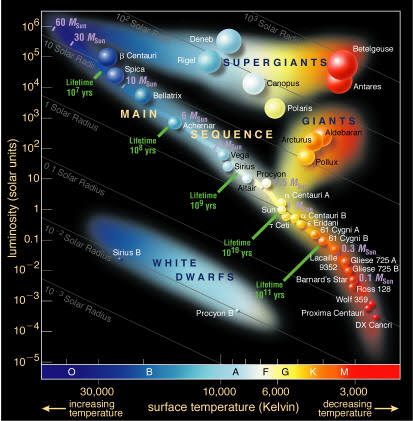
Imagine a scatter plot, but instead of city neighborhoods, you’re mapping stars. The H-R diagram’s x-axis runs from hot to cool—left to right, the temperature drops. On the left, you’ll find blue O-type stars, burning above 30,000 Kelvin. On the right, red M-type stars, barely above 2,400 Kelvin. Sometimes, astronomers use a color index (B–V) instead of temperature, but the idea’s the same .
The y-axis climbs from dim to bright. At the bottom, faint stars; at the top, the universe’s beacons. We measure this in absolute luminosity (compared to the Sun) or absolute magnitude (a lower number means brighter).
Why does temperature run “backwards”? It’s a quirk of history. Spectral types were classified before we knew their temperatures, so the hottest stars ended up on the left.
A star’s spot on this chart isn’t random. It tells you its temperature, brightness, size, and even its stage of life. Just like a city map shows where people cluster, the H-R diagram shows where stars spend their time.
The Spectral Alphabet: How We Classify Stars
From O to M — and Beyond
Stars come in a cosmic rainbow, sorted by their spectra. Astronomers use the OBAFGKM sequence—remembered by the phrase “Oh Be A Fine Girl/Guy Kiss Me.” Each letter marks a different temperature and color. For the coolest, faintest objects, we add L, T, and Y classes for brown dwarfs and ultra-cool stars .
But there’s more. Each star also gets a luminosity class: I for supergiants, II for bright giants, III for giants, IV for subgiants, and V for main sequence dwarfs. Our Sun? It’s a G2V: class G, subtype 2, main sequence dwarf.
Here’s a table to make sense of it all:
| Spectral Type | Temperature Range (K) | Color | Luminosity Class Examples | Notable Star Examples |
|---|---|---|---|---|
| O | >30,000 | Blue | V (Main Sequence), Ia (Supergiant) | Spica (B1V, ~22,400 K, L~12,100 L☉) |
| B | 10,000–30,000 | Blue-white | Ia (Supergiant) | Rigel (B8Ia, ~12,100 K, L~120,000 L☉) |
| A | 7,500–10,000 | White | V (Main Sequence) | Sirius A (A1V, 9,940 K, L~25 L☉), Vega (A0V, ~9,600 K, L~40 L☉) |
| F | 6,000–7,500 | Yellow-white | Ib (Supergiant) | Canopus (F0Ib, ~7,400 K, L~10,700 L☉) |
| G | 5,200–6,000 | Yellow | V (Main Sequence) | Sun (G2V, 5,778 K, L=1 L☉) |
| K | 3,700–5,200 | Orange | III (Giant) | Aldebaran (K5III, ~3,900 K, L~400 L☉) |
| M | 2,400–3,700 | Red | Ib (Supergiant), Ve (Red Dwarf) | Betelgeuse (M2Ib, ~3,500 K, L~100,000 L☉), Proxima Centauri (M5.5Ve, ~3,042 K, L~0.0017 L☉) |
The Five Districts of the H-R Diagram
The Main Sequence: Where Stars Spend Most of Their Lives
About 90% of all stars, including our Sun, live on the main sequence. Here, they fuse hydrogen into helium in their cores. The main sequence runs diagonally from the upper-left (hot, bright O-type stars) to the lower-right (cool, dim M-type stars). The Zero Age Main Sequence (ZAMS) marks where stars first ignite hydrogen fusion. As they age, they drift slightly away from this line .
The Sun sits right in the middle: G2V, 5,778 K, 1 L☉, absolute magnitude +4.83.
The Giant Branch: Stars That Have Run Out of Fuel
Above the main sequence, you’ll find the red giants. These stars have burned through their core hydrogen and ballooned in size. Aldebaran, a K-type giant, glows at ~400 times the Sun’s luminosity and a temperature of ~3,900 K .
The Supergiant Region: The Universe’s Most Extreme Stars
At the very top of the diagram, supergiants rule. Betelgeuse (M2Ib, ~100,000 L☉, ~3,500 K) and Rigel (B8Ia, ~120,000 L☉, ~12,100 K) are both supergiants, but one is cool and red, the other hot and blue-white. Both are enormous, both are dying, and both will end in spectacular supernovae .
The White Dwarf Region: The Embers of Dead Stars
Down in the lower-left, white dwarfs glow fiercely hot but faint. They’re tiny—about the size of Earth—but can reach temperatures above 20,000 K. Sirius B (DA2, ~24,000 K, L~0.04 L☉, absolute magnitude +11.2) is a classic example. These are the final stage for stars like our Sun .
The Horizontal Branch and the Instability Strip
In star clusters, you’ll spot a horizontal branch—stars burning helium in their cores. The instability strip, crossing the horizontal branch, is home to variable stars like RR Lyrae and Cepheid variables. These stars pulse in brightness, and their regular rhythms help us measure cosmic distances .
A Star’s Life Story, Written in One Chart
Birth: From Gas Cloud to the Zero Age Main Sequence
Every star begins as a cloud of gas and dust. Gravity pulls it together, heating it up. When the core gets hot enough, hydrogen fusion ignites. The star lands on the ZAMS. Its position depends almost entirely on its mass .
The Long Middle: Life on the Main Sequence
Stars like the Sun spend about 10 billion years fusing hydrogen. Massive O-type stars burn through their fuel in just a few million years. Tiny red dwarfs like Proxima Centauri could shine for trillions of years .
The Hertzsprung Gap: A Cosmic Blink
Between the upper main sequence and the red giant branch lies the Hertzsprung Gap. Stars cross this region in just thousands of years—a blink in cosmic time. That’s why so few stars are caught there. It marks the transition from core hydrogen burning to shell burning and the start of helium fusion .
Red Giant and Beyond: The Dramatic End
After the main sequence, stars swell into giants or supergiants. The Sun will become a red giant, shed its outer layers as a planetary nebula, and leave behind a white dwarf. Massive stars explode as supernovae, leaving neutron stars or black holes .
Star Clusters as H-R Diagram Laboratories
Star clusters are nature’s perfect experiment. All their stars were born together, from the same cloud, at the same time. When we plot their H-R diagrams, we see a sharp main sequence, a turn-off point, a red giant branch, and a horizontal branch.
The main-sequence turn-off point tells us the cluster’s age. The brightest, most massive stars leave the main sequence first. As the cluster ages, the turn-off point moves down and right. Globular clusters in our galaxy show turn-off ages of 10–13 billion years—some of the oldest things we know .
Measuring the Universe with the H-R Diagram: Spectroscopic Parallax
How do we measure the distance to a star too far for trigonometric parallax? Enter spectroscopic parallax. By reading a star’s spectral type and luminosity class, we can find its absolute magnitude from the H-R diagram. Compare that to its apparent magnitude, and you get the distance. It’s a key step on the cosmic distance ladder .
What the Gaia Mission Revealed About the H-R Diagram
The European Space Agency’s Gaia mission has changed everything. With precise measurements for over a billion stars, Gaia’s H-R diagrams are sharper and more detailed than ever. We can now see subtle features, rare evolutionary stages, and confirm our theories about stellar evolution. Gaia has improved our calibration of the main sequence, ZAMS, and even found stars in the elusive Hertzsprung Gap .
| Star Name | Spectral Class | Temperature (K) | Luminosity (L☉) | Absolute Magnitude | H-R Region |
|---|---|---|---|---|---|
| Sun | G2V | 5,778 | 1 | +4.83 | Main Sequence |
| Sirius A | A1V | 9,940 | ~25 | +1.4 | Main Sequence |
| Vega | A0V | ~9,600 | ~40 | +0.6 | Main Sequence |
| Spica | B1V | ~22,400 | ~12,100 | -3.5 | Main Sequence |
| Proxima Centauri | M5.5Ve | ~3,042 | ~0.0017 | +15.5 | Main Sequence (Red Dwarf) |
| Canopus | F0Ib | ~7,400 | ~10,700 | -5.5 | Supergiant |
| Aldebaran | K5III | ~3,900 | ~400 | -0.6 | Giant |
| Betelgeuse | M2Ib | ~3,500 | ~100,000 | -5.6 | Supergiant |
| Rigel | B8Ia | ~12,100 | ~120,000 | -7.0 | Supergiant |
| Sirius B | DA2 | ~24,000 | ~0.04 | +11.2 | White Dwarf |
Why Size and Temperature Both Matter: The Stefan-Boltzmann Law
Ever wonder why a tiny white dwarf can be as hot as a blue giant, yet so faint? Or why a cool red giant can outshine a much hotter star? The answer lies in the Stefan-Boltzmann law, which connects a star’s luminosity (L), radius (R), and temperature (T):
L ∝ R2 T4
L is luminosity, R is radius, T is surface temperature.
A star’s brightness depends on both how big it is and how hot it burns. That’s why a huge, cool red giant can shine as brightly as a tiny, blazing white dwarf.
Conclusion
The Hertzsprung-Russell diagram isn’t just a chart—it’s a map of the universe’s greatest stories. From the first insights of Hertzsprung and Russell, to the spectral alphabet, to the five great regions where stars live and die, the H-R diagram shows us how stars are born, live, and end. It lets us measure the ages of clusters, map the distances to far-off suns, and, thanks to Gaia, see the universe in sharper detail than ever before.
What does it mean that we can read a star’s life story from its light alone? It means we’re not just observers—we’re explorers, decoding the universe’s secrets with reason and curiosity. At FreeAstroScience, we’re here to keep your mind active, to help you see the cosmos with fresh eyes, and to remind you: never let the sleep of reason breed monsters.
Come back soon to FreeAstroScience.com. There’s always more to learn, and the stars are waiting.
References
- Wikipedia – Hertzsprung–Russell diagram
- Encyclopaedia Britannica – Hertzsprung-Russell diagram
- NASA Chandra X-ray Center – Stellar Evolution
- NASA Chandra – Variable Stars and H-R Diagram
- ESA CESAR – The Hertzsprung-Russell Diagram
- Swinburne University – Cosmos: Hertzsprung-Russell Diagram
- Science Notes – Hertzsprung-Russell Diagram in Astronomy
- Linda Hall Library – Ejnar Hertzsprung (Scientist of the Day)
- Wikipedia – Stellar Classification
- ScienceDirect – Zero Age Main Sequence Stars
- Wikipedia – Hertzsprung Gap
I do not even understand how I ended up here, but I assumed this publish used to be great